
Roulette Odds vs Win Rate: Why 90% Doesn't Always Mean an Edge
A 90% win rate sounds exceptional. But in roulette, the number of spins allowed can completely change what that percentage means.
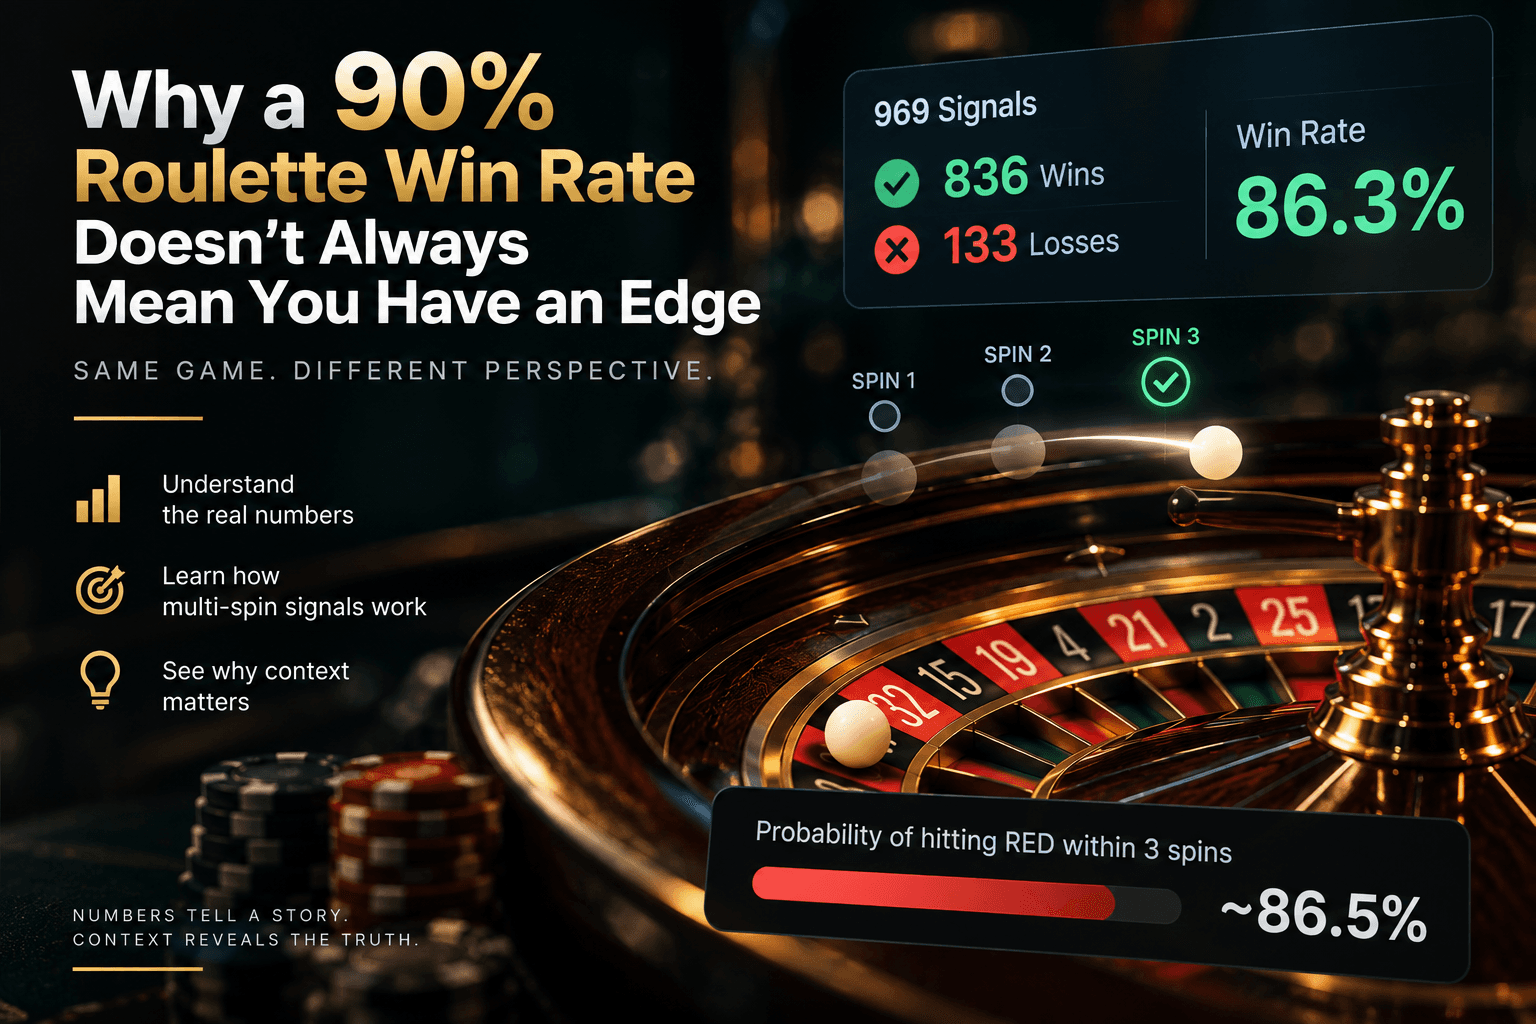
Imagine seeing this result:
969 signals. 836 wins. 133 losses. 86.3% win rate.
At first glance, those numbers look extremely strong.
But there is a detail that changes how they should be interpreted: how many spins does each signal have to win?
One Prediction vs Multiple Attempts
Suppose a signal says:
🔴 RED
If the signal is judged only on the next spin, the result is simple. Red appears or it doesn't.
Now give the same signal up to three spins.
The signal can lose the first spin, lose the second, hit RED on the third — and still finish as a win.
Naturally, the expected win rate becomes much higher.
Roulette Odds: The 3-Spin Example
On European roulette, RED covers 18 of 37 numbers. These are the basic roulette odds every signal starts from.
The probability of missing RED once is approximately 51.35%.
Missing it three times in a row is (see roulette odds and streak probability):
0.5135 × 0.5135 × 0.5135 ≈ 13.5%
So the probability of seeing RED at least once within three spins is approximately:
86.5%
And that's before using any predictive signal at all.
This is why an 86–90% win rate across a three-spin window needs context.
The Number That Matters
Instead of asking:
“What is the win rate?”
A better question is:
“How far above the expected baseline is the win rate?”
If the natural baseline is around 86.5% and a system produces 87%, the difference is small.
If it consistently produces meaningfully higher results across thousands of independent signals, that becomes much more interesting.
Sample Size Matters Too
A 95% win rate across 20 signals tells you very little.
An 89% win rate across several thousand properly tracked signals provides much more information.
This is why we track:
- total signals
- wins and losses
- evaluation window
- expected baseline
- historical performance
- performance over different time periods
The goal is to separate short-term variance from patterns that persist.
Read the Statistics, Not Just the Headline
High percentages look impressive, but percentages without context can be misleading.
Whenever you evaluate roulette signals, check three things:
Win Rate + Sample Size + Expected Baseline
Together, they give you a much clearer picture of what the results actually mean.
Baseline Win Rate by Number of Spins
The longer a signal stays open, the higher the win rate it earns without any skill. For a RED signal on a European wheel (18 red numbers of 37), the chance that red appears at least once is:
| Spins allowed | Win rate by chance |
|---|---|
| 1 | 48.65% |
| 2 | 73.63% |
| 3 | 86.46% |
| 4 | 93.05% |
| 5 | 96.43% |
Any signal result has to be compared with the row that matches its window. A 90% win rate is poor on a 4-spin window and strong on a 1-spin window.
Worked Example: 836 Wins From 969 Signals
The result at the top of this guide is 836 wins from 969 signals, which is 86.27%. On a 3-spin window the baseline is 86.46%.
The signal sits 0.19 percentage points below chance. With 969 signals the margin of error is about 2 points either way, so this result is indistinguishable from random play. It looks impressive only because 86% is high in isolation.
What a Real Edge Would Look Like
A signal with a real edge would beat its baseline by more than the margin of error, across thousands of signals, and keep doing so on new data. The dashboard number to watch is the gap between win rate and baseline, not the win rate itself.
Keep Reading
- Roulette rules and payouts
- Roulette predictor signals: what the win rate means
- Do roulette systems work? Why 20 wins prove nothing
- Roulette streak odds and the Monte Carlo fallacy
Roulette remains a game of chance. Statistical analysis and historical results cannot guarantee future outcomes.